
 av
av Hentet: https://www.drroyspencer.com/2024/09/uah-global-temperature-update-for-august-2024-0-88-deg-c/
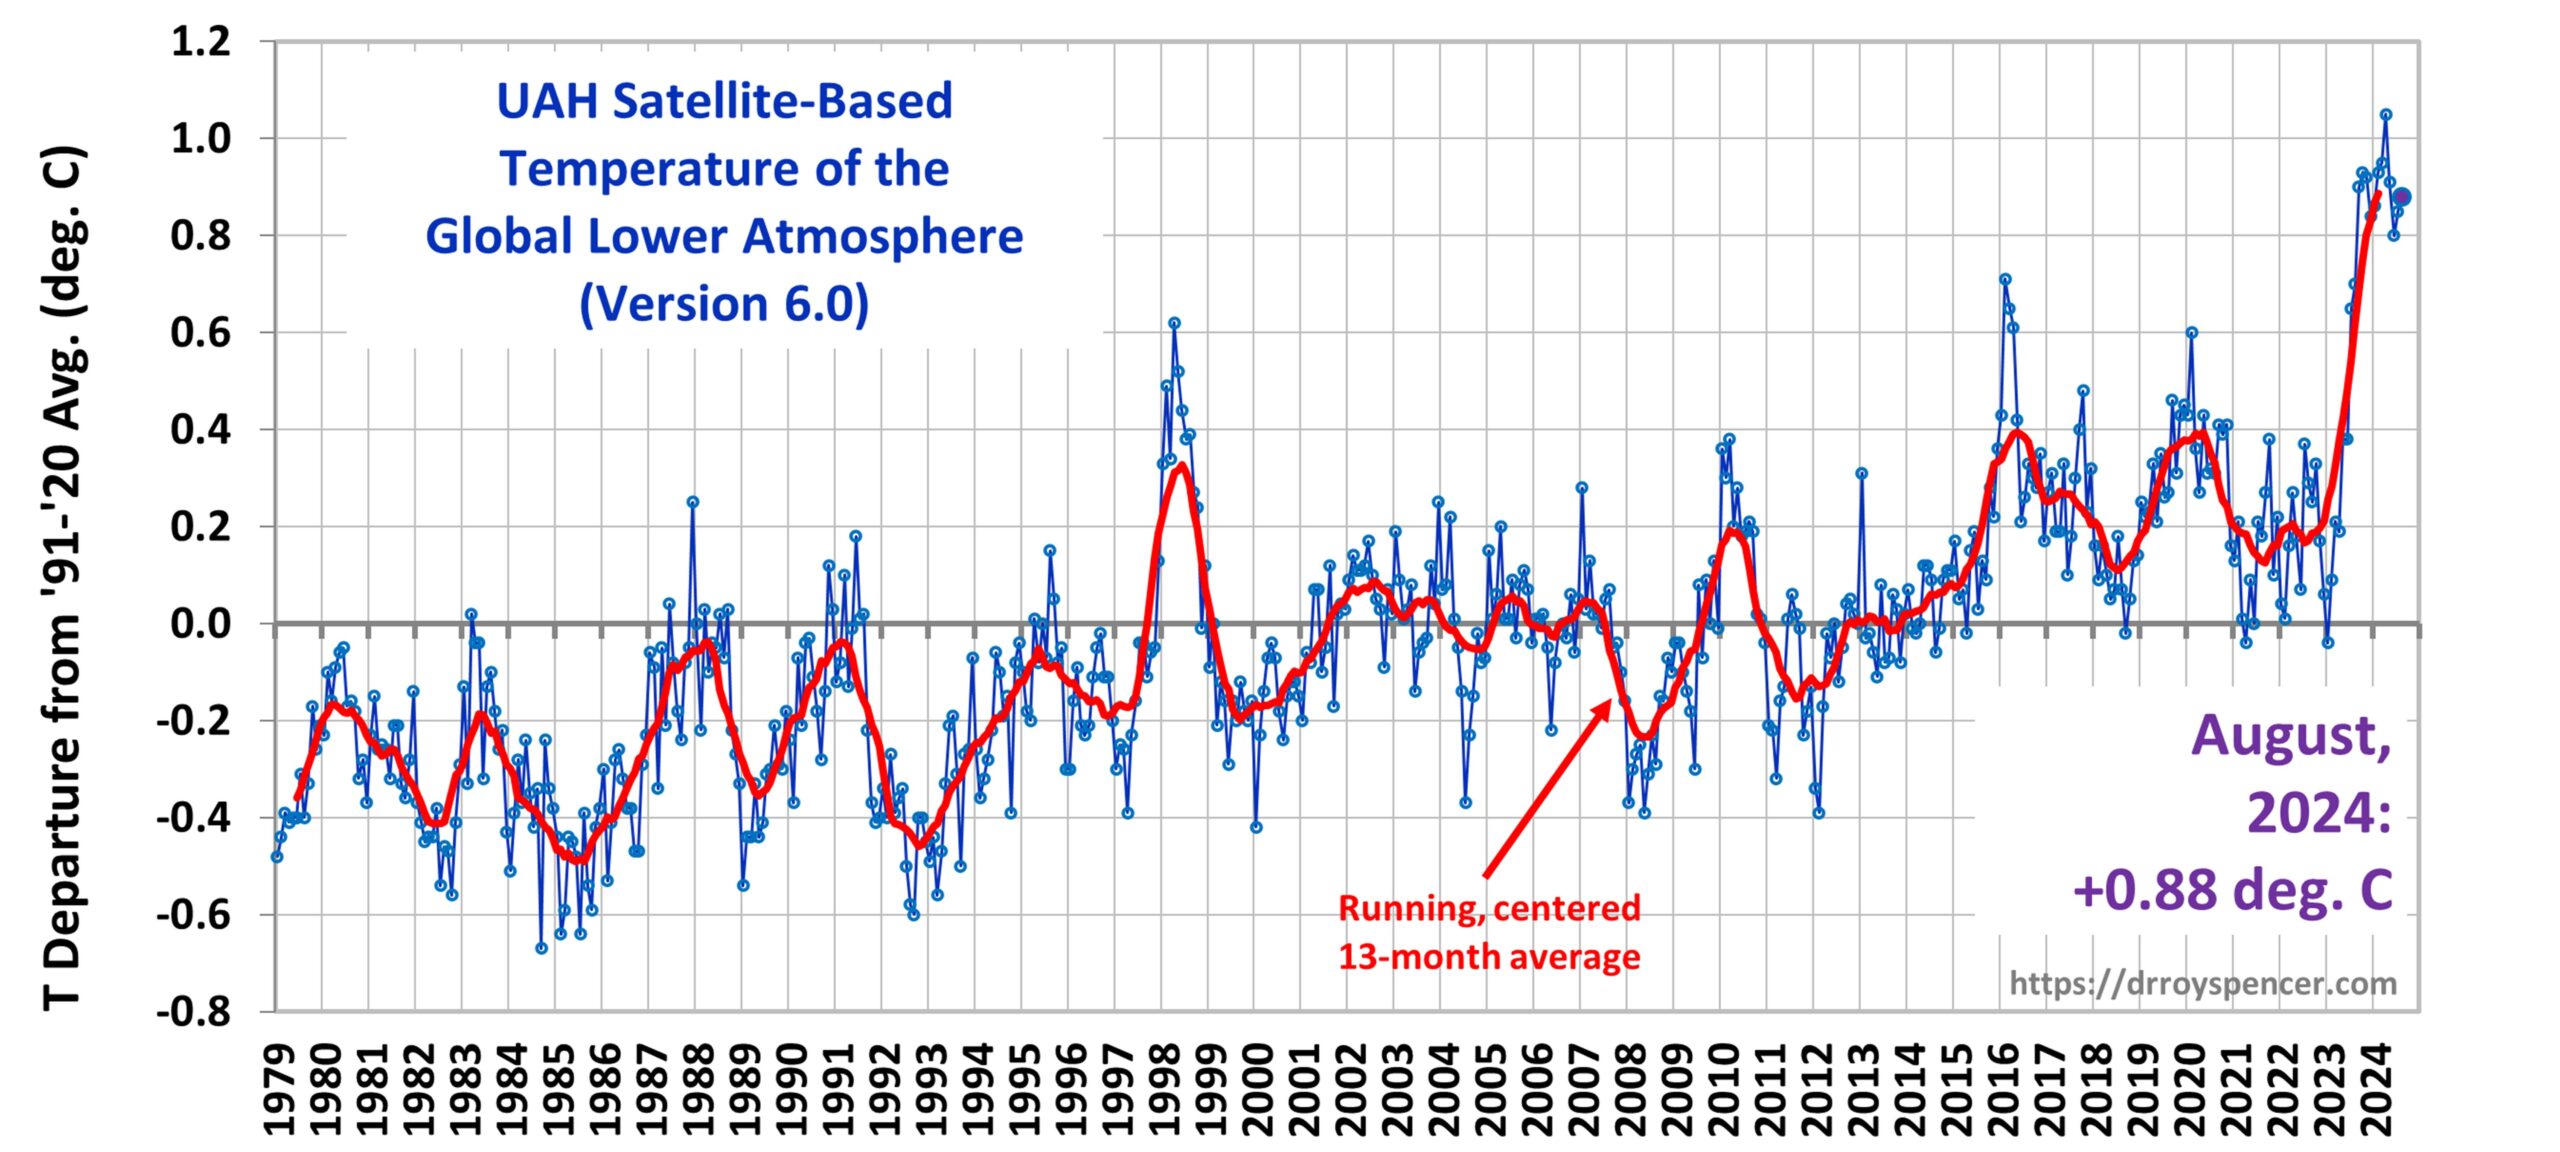
UAH Global Temperature Update for August, 2024: +0.88 deg. C
September 2nd, 2024 by Roy W. Spencer, Ph. D.
The Version 6 global average lower tropospheric temperature (LT) anomaly for August, 2024 was +0.88 deg. C departure from the 1991-2020 mean, up slightly from the July, 2024 anomaly of +0.85 deg. C.
Persistent global-averaged warmth was (unusually) contributed to this month by the Southern Hemisphere. Of the 27 regions we routinely monitor, 5 of them set record-warm (or near-record) high monthly temperature anomalies in August, all due to contributions from the Southern Hemisphere:
Global land: +1.35 deg. C
Southern Hemisphere land: +1.87 deg. C
Southern Hemisphere extratropical land: +2.23 deg. C
Antarctica: +3.31 deg. C (2nd place, previous record was +3.37 deg. C, Aug. 1996)
Australia: +1.80 deg. C.
The linear warming trend since January, 1979 now stands at +0.16 C/decade (+0.14 C/decade over the global-averaged oceans, and +0.21 C/decade over global-averaged land).
The following table lists various regional LT departures from the 30-year (1991-2020) average for the last 20 months (record highs are in red):
| YEAR | MO | GLOBE | NHEM. | SHEM. | TROPIC | USA48 | ARCTIC | AUST |
| 2023 | Jan | -0.04 | +0.05 | -0.13 | -0.38 | +0.12 | -0.12 | -0.50 |
| 2023 | Feb | +0.09 | +0.17 | +0.00 | -0.10 | +0.68 | -0.24 | -0.11 |
| 2023 | Mar | +0.20 | +0.24 | +0.17 | -0.13 | -1.43 | +0.17 | +0.40 |
| 2023 | Apr | +0.18 | +0.11 | +0.26 | -0.03 | -0.37 | +0.53 | +0.21 |
| 2023 | May | +0.37 | +0.30 | +0.44 | +0.40 | +0.57 | +0.66 | -0.09 |
| 2023 | June | +0.38 | +0.47 | +0.29 | +0.55 | -0.35 | +0.45 | +0.07 |
| 2023 | July | +0.64 | +0.73 | +0.56 | +0.88 | +0.53 | +0.91 | +1.44 |
| 2023 | Aug | +0.70 | +0.88 | +0.51 | +0.86 | +0.94 | +1.54 | +1.25 |
| 2023 | Sep | +0.90 | +0.94 | +0.86 | +0.93 | +0.40 | +1.13 | +1.17 |
| 2023 | Oct | +0.93 | +1.02 | +0.83 | +1.00 | +0.99 | +0.92 | +0.63 |
| 2023 | Nov | +0.91 | +1.01 | +0.82 | +1.03 | +0.65 | +1.16 | +0.42 |
| 2023 | Dec | +0.83 | +0.93 | +0.73 | +1.08 | +1.26 | +0.26 | +0.85 |
| 2024 | Jan | +0.86 | +1.06 | +0.66 | +1.27 | -0.05 | +0.40 | +1.18 |
| 2024 | Feb | +0.93 | +1.03 | +0.83 | +1.24 | +1.36 | +0.88 | +1.07 |
| 2024 | Mar | +0.95 | +1.02 | +0.88 | +1.35 | +0.23 | +1.10 | +1.29 |
| 2024 | Apr | +1.05 | +1.25 | +0.85 | +1.26 | +1.02 | +0.98 | +0.48 |
| 2024 | May | +0.90 | +0.98 | +0.83 | +1.31 | +0.38 | +0.38 | +0.45 |
| 2024 | June | +0.80 | +0.96 | +0.64 | +0.93 | +1.65 | +0.79 | +0.87 |
| 2024 | July | +0.85 | +1.02 | +0.68 | +1.06 | +0.77 | +0.67 | +0.01 |
| 2024 | August | +0.88 | +0.96 | +0.81 | +0.88 | +0.69 | +0.94 | +1.80 |
The full UAH Global Temperature Report, along with the LT global gridpoint anomaly image for August, 2024, and a more detailed analysis by John Christy, should be available within the next several days here.
Lower Troposphere:
http://vortex.nsstc.uah.edu/data/msu/v6.0/tlt/uahncdc_lt_6.0.txt
Mid-Troposphere:
http://vortex.nsstc.uah.edu/data/msu/v6.0/tmt/uahncdc_mt_6.0.txt
Tropopause:
http://vortex.nsstc.uah.edu/data/msu/v6.0/ttp/uahncdc_tp_6.0.txt
Lower Stratosphere:
http://vortex.nsstc.uah.edu/data/msu/v6.0/tls/uahncdc_ls_6.0.txt